Hotel economics
The +108% TRevPAR headline is real - and it needs unpacking before it goes into your investment memo. Here is the honest version of hotel wellness economics, lever by lever, with the sources attached.
Hotel economics · 2026-09-05
Start with the headline done right: RLA Global × HotStats (2024) compared hotels with a 'major wellness' offer - wellness revenue above $1 m/year or 10%+ of total - against hotels with none, and found +108% total revenue per available room. Correlation includes positioning: wellness hotels are often premium hotels. The number tells you which league invests in wellness; your uplift depends on execution.
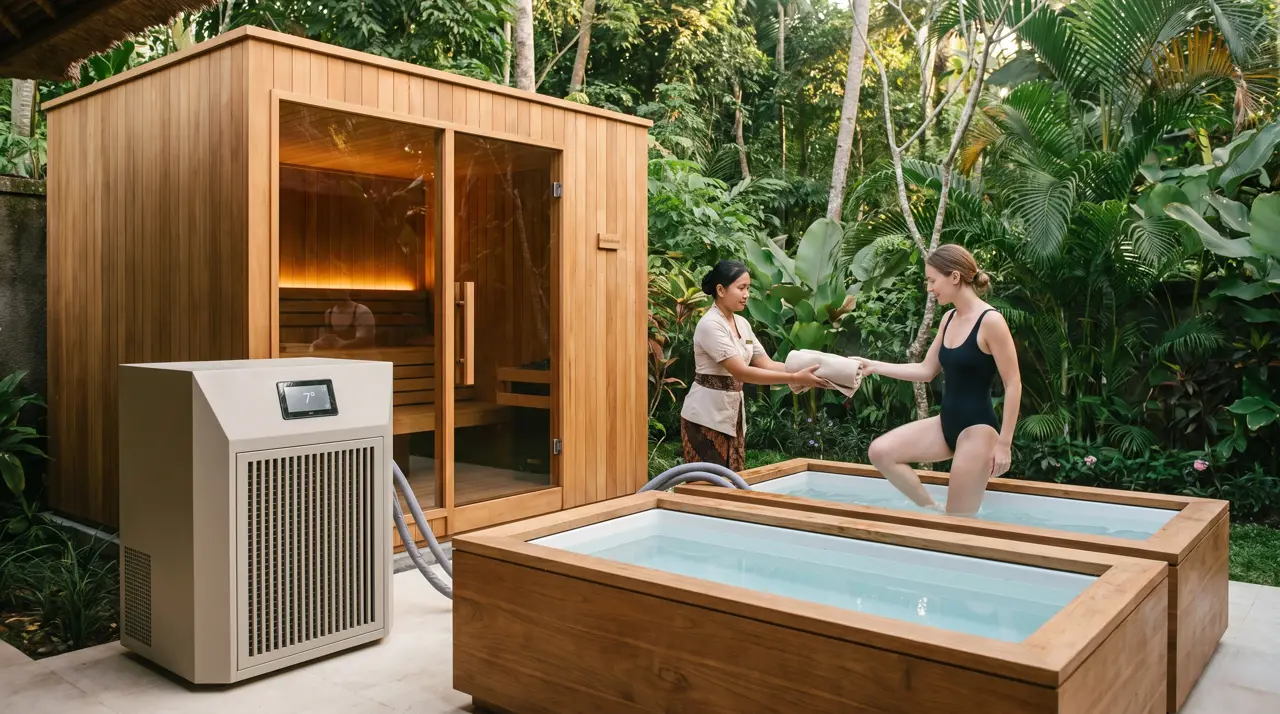
Wellness inventory prices above base. In short-term rental data the cleanest proxy is amenity-level: a hot tub lifts nightly rate +14.3%, a sauna +7.4% (AirDNA). Hotels do it through room-plus-ritual packages and suite premiums - the Ubud resort case runs a bookable 75-minute circuit that anchors exactly that.
Wellness travellers are the industry's best customers: international ones spend 36% more per trip, domestic 163% more (Global Wellness Institute, 2023 data), and platform surveys report wellness guests staying 2-3 nights longer (SiteMinder). Wellness trips are 7.8% of trips but 18% of tourism spending (GWI Monitor 2024).
Recovery has no weather. In our Bali projects the spa calendar fills from the rainy quarter first - which is why we advise GMs to schedule the build in low occupancy and open into the recovery.
Day-pass recovery is the quiet second door: capped slots for outside guests at premium prices. It needs an entry flow designed for it - we plan that into the free layout - and it turns the zone from amenity into profit centre.
| Line | Working figure | Note |
|---|---|---|
| Capex, resort zone | Rp 800 juta - 1.5 miliar | see pricing page |
| Operating cost | electricity + consumables + service | single-digit juta/month |
| Ritual product | 75-90 min, 4-6 guests, premium priced | your rate card |
| Day passes | capped slots, weekend-first | second revenue door |
| Rate/package uplift | hotel-specific | the biggest lever, hardest to isolate |
We will not print a fake payback month. What we print: the capex band before you commit (pricing), the operating cost per set (a lidded 400 L tub: ≈ Rp 214 ribu/month of electricity), and the industry levers above with their sources. Build the model with your ADR - and if the spreadsheet does not clear your hurdle rate, we would rather you know before we build.
No - it compares wellness-led properties to none at portfolio level. Treat it as the ceiling of the category, not your forecast; the four levers above are how your version gets built.
Typically the resort-zone tier: 8-person sauna, one plunge (pool or two tubs), warm soak optional. Sized properly to your peak hour in the free layout.
Hybrid wins in our projects: open access off-peak, paid guided ritual at prime slots, day passes for outsiders. Free-only leaves the profit centre unbuilt.
Keep reading
The hot-cold cycle through actual studies: what is proven, promising, and hype.
View →
Premiums, nightly rates and the setups that actually move villa economics.
View →
Premium tiers, churn logic and the cases behind recovery's gym-economics claim.
View →Questions?
Tell us about the property - we reply with a layout sketch, equipment list and an indicative budget.